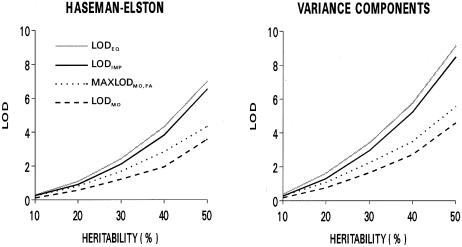
Figure 2.
Median LOD scores, in analysis of 500 replicates generated for a nonimprinted quantitative-trait locus, for each of the tests of linkage, by the proportion of phenotypic variance attributed to the locus (heritability). Values for LODFA were virtually identical to those for LODMO and, thus, are not shown. For comparability, P values for LODIMP and MAXLODMO,FA have been converted to equivalent LOD scores.

