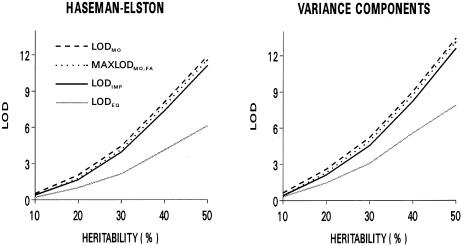
Figure 3.
Median LOD scores, in analysis of 500 replicates generated for a maternally expressed quantitative-trait locus, for each of the tests of linkage, by the proportion of phenotypic variance attributed to the locus (heritability). Values for LODFA were 0 for all values of heritability and, thus, are not shown. For comparability, P values for LODIMP and MAXLODMO,FA have been converted to equivalent LOD scores.

