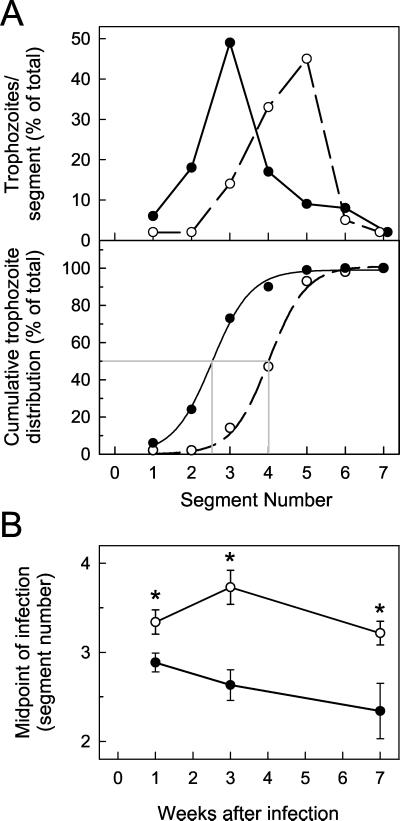
FIG. 5.
G. muris trophozoite distribution along the orad-caudad axis of the small intestine. B-cell KO mice (○) and wild-type littermate C57 control mice (•) were infected orally with 104 G. muris cysts, and the number of trophozoites was determined in each of seven equally spaced segments along the small intestine, with segment 1 being the most orad segment. The numbers were then expressed as a percentage of the total trophozoite load in the small intestine, as shown in a representative example in panel A (top) for two individual mice at 3 weeks after infection. The cumulative percent trophozoite load, i.e., the sum of the percentages of the specific segment and all the segments orad of that segment, was determined for each intestinal segment, as depicted by the symbols in panel A (bottom) for the same mice shown in panel A (top). Subsequently, a sigmoid function was calculated that describes a curve with the best fit to each set of data points, as depicted by the solid and dashed lines in panel A (bottom). Based on this sigmoid function, the midpoint of the infection, i.e., the segment number (or fraction thereof) for which 50% of all trophozoites were on the orad side and 50% on the caudad side of the small intestine, was determined, as shown by the gray lines in panel A (bottom). In the example shown, the midpoint of infection was at segment 2.5 for the C57 control mouse and segment 4.0 for the B-cell KO mouse. Panel B shows a summary of the results from different times after infection. Values are means ± SEM from seven or more mice for each data point. Asterisks indicate values from B-cell KO mice that are significantly different from controls at the same time point (P < 0.05 by Student’s t test).

