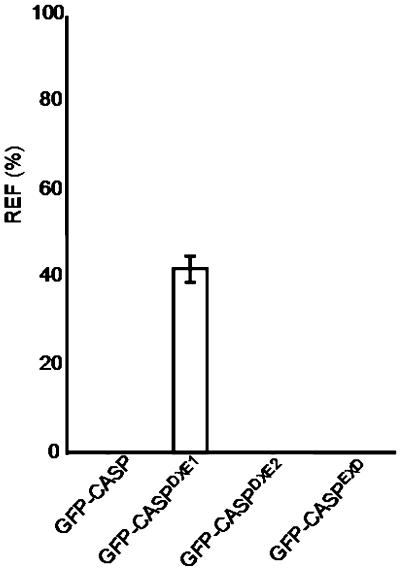
Figure 5.
Quantification of ER Fluorescence for GFP-CASP and Its Mutants.
The fluorescence of the ER relative to that of the Golgi was quantified for each of the GFP-CASP derivatives. The relative ER fluorescence (REF) is given as a percentage as described for Figure 3. Error bars represent sd for 21 measurements.

