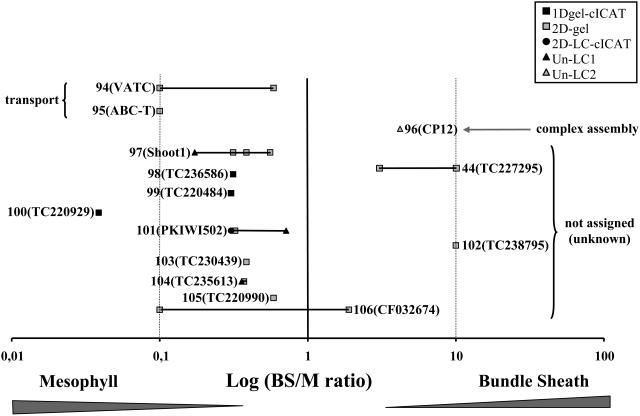
Figure 9.
Overview of BS:M Ratio Determinations by the Three Complementary Methods.
The 125 quantified maize proteins (ZmGI accessions) were divided in Figures 6 to 9 and are grouped by function; here, we show the fourth group. BS:M protein accumulation ratios obtained for each protein by three different methods (closed squares, 1-DE gel cICAT; circles, 2D-LC-cICAT; open squares, 2-DE gels; closed triangles, unlabeled LC1; open triangles, unlabeled LC2) were plotted on a logarithmic scale. The numbers represent the different quantified proteins. The actual accession numbers and associated information can be found in Table 2. A number of similar accessions that could not unambiguously be individually quantified were grouped together. In some cases, one of the three quantification methods allowed individual quantification and are marked with an asterisk. The protein name abbreviations are indicated as follows: 94, vacuolar ATP synthase subunit C (VATC); 95, ABC transporter putative (ABC-T); 96, CP12 protein precursor (CP12); 97, SHOOT1 protein (Shoot1); 98, unknown (TC236586); 99, aldo/keto reductase family protein (TC220484); 100, unknown (TC220929); 101, fruit protein PKIWI502 (PKIWI502); 102, inositol monophosphate family protein (TC238795); 103, unknown (TC230439); 104, Y230_ARATH (TC235613); 105, unknown (TC220990); 106, unknown (CF032674).

