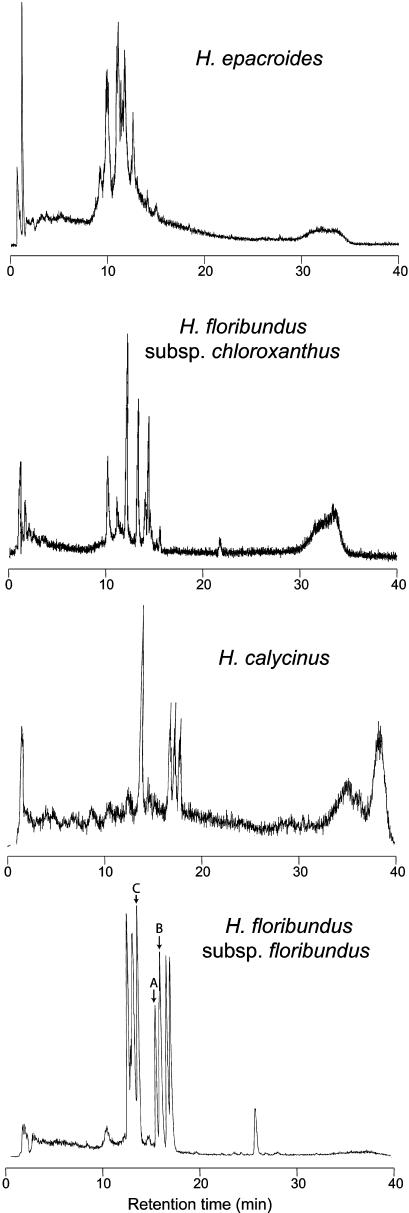
Figure 3.
Sample LC-MS Traces of Selected Collections.
Total ion count is graphed against retention time. Variations in peptide concentration and diversity are seen, and the dried herbarium specimen of H. floribundus subsp chloroxanthus is shown to give comparable data quality to fresh material. The peaks of Hyfl A-C sequenced in this study are indicated in the trace of H. floribundus subsp floribundus with corresponding letters.

