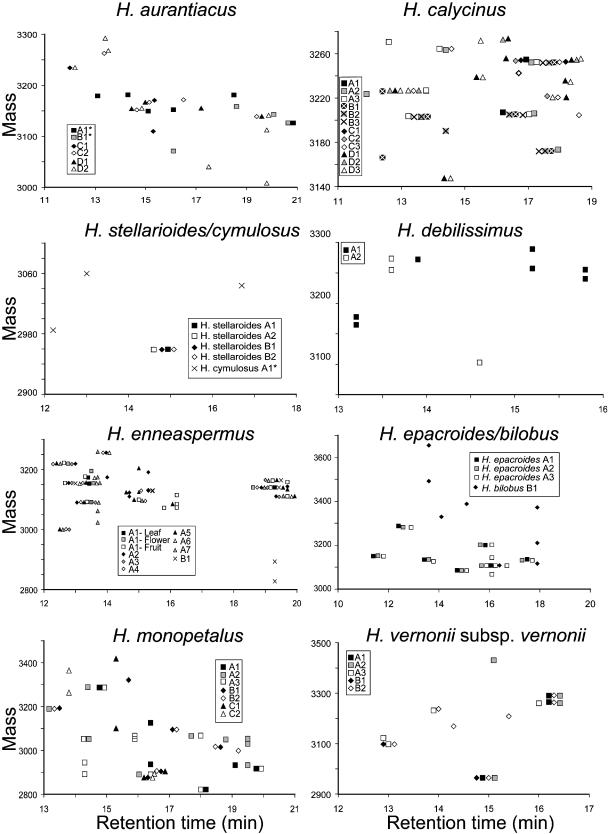
Figure 5.
Scatterplots of Hybanthus Peptide Masses and Retention Times.
Individual species and collection locations are indicated with different symbols in each plot. Collections of individual plants from one location are differentiated by shading. Masses range from 2800 to 3700 D and retention times from 10 to 20 min. Horizontal clusters of peaks reflect possible common peptides. Overlapping peaks have been horizontally dispersed for clarity.

