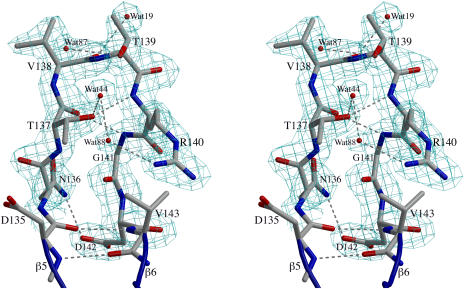
Figure 2.
Electron Density Map Quality and the RGD Loop Structure.
A stereodiagram of the 2Fo–Fc electron density map contoured at 1.0 ρrms shows clear density for the main chain atoms and most of the side chain atoms of the RGD loop of chain B in the form-II crystals. The residues are labeled, and four water sites observed in all four molecules of ToxA are shown. Hydrogen bonds are indicated by dashed lines. This figure was prepared using BobScript (Esnouf, 1999) and Raster3D (Merritt and Bacon, 1997).

