Fig. 2.
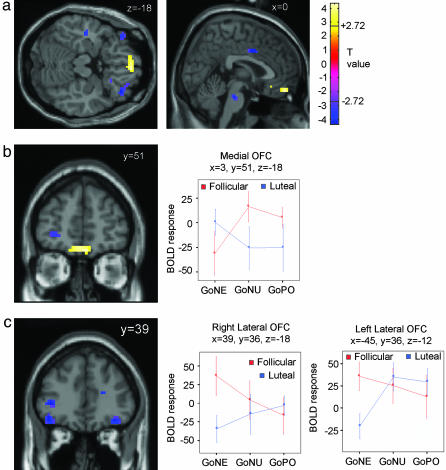
OFC activity in response to emotional stimuli across the menstrual cycle. (a) Axial (z = -18) and sagital (x = 0) sections showing increased medial OFC and decreased lateral OFC activity for the negative go vs. neutral go condition in the premenstrual (luteal) vs. postmenstrual (follicular) phases of the menstrual cycle. Color coding in the scale represents study specific t values (right = right). (b) A coronal section at y = 51 showing increased medial OFC activity for the negative go vs. neutral go condition in the premenstrual vs. postmenstrual phases of the menstrual cycle. The graph shows BOLD response (arbitrary units) at the medial OFC point showing maximum activity in the premenstrual vs. postmenstrual phases of the cycle to negative go vs. neutral go words (3, 51, -18). Activity is shown for negative go (GoNE), neutral go (GoNU), and positive go (GoPO) words relative to a resting baseline in the premenstrual and postmenstrual phases. (c) A coronal section at y = 39 showing decreased right and left lateral OFC activity for the negative go vs. neutral go condition in the premenstrual vs. postmenstrual phases of the menstrual cycle. The graph shows BOLD response (arbitrary units) at the right lateral (39, 36, -18) and left lateral (-45, 36, -12) OFC points showing minimum activity in the premenstrual vs. postmenstrual phases of the cycle to negative go vs. neutral go words. Activity is shown for negative go (GoNE), neutral go (GoNU), and positive go (GoPO) words relative to a resting baseline in the premenstrual and postmenstrual phases.

