Fig. 2.
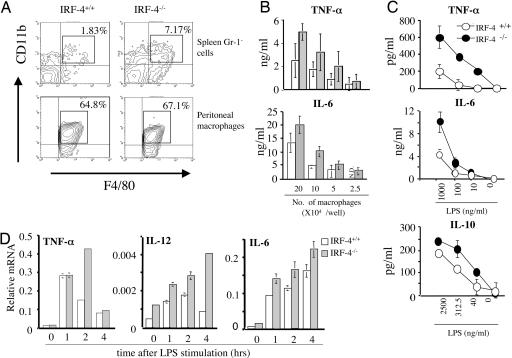
Increased macrophages and their hyperresponse to LPS in vitro in IRF-4-/- mice. (A)(Upper) CD11b and F4/80 expression of spleen cells is shown after gating on the Gr-1- population. The number in the upper right corner of each profile indicates the percentage of Gr-1-CD11b+F4/80+ cells in total spleen cells. (Lower) Peritoneal adherent macrophages were stained for CD11b and F4/80. The proportion of the cells within the box is indicated. (B) Graded numbers of peritoneal macrophages (2.5–20 × 104) from IRF-4+/+ (open bars) and IRF-4-/- (gray bars) mice were stimulated with LPS (1 μg/ml). The production of cytokines in the supernatant was determined by ELISA. (C) Peritoneal macrophages (1 × 10⁵ per well for TNF-α and IL-6 and 2 × 10⁵ per well for IL-10) from IRF-4+/+ (open circles) and IRF-4-/- (filled circles) mice were stimulated with varying amounts of LPS for 24 h. (D) The expression levels of TNF-α, IL-12, and IL-6 were determined by real-time RT-PCR in IRF-4+/+ or IRF-4-/- peritoneal macrophages 0–4 h after stimulation with LPS (1 μg/ml).

