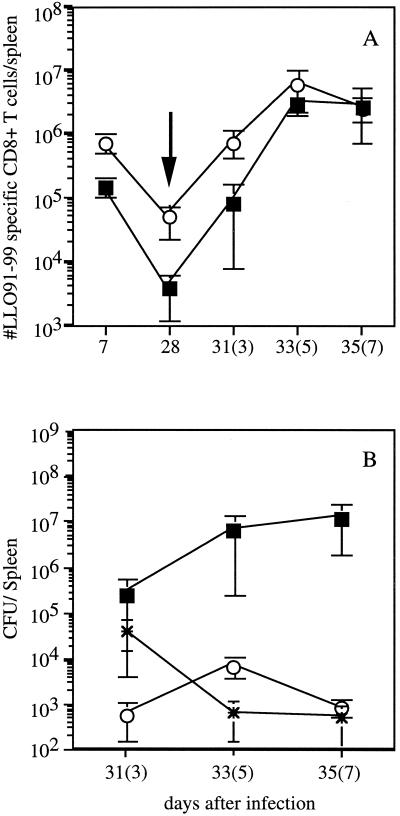
FIG. 4.
Kinetics of CD8+-T-cell responses in mice immunized with low and high doses of actA-deficient L. monocytogenes. (A) BALB/c mice were immunized with either 500 (squares) or 106 (circles) CFU of actA-deficient L. monocytogenes. Mice were challenged 28 days later with 2 × 10⁵ CFU of L. monocytogenes NPns (arrow). The number of LLO91-99-specific CD8+ T cells per spleen was determined by intracellular cytokine staining for IFN-γ on the indicated days (numbers of days after challenge are in parentheses). The reliable limit of detection is ∼5 × 10³ antigen-specific CD8+ T cells. Data are from a representative experiment from three independent experiments and are means ± SDs for three mice/group. (B) Following the challenge, the ability of mice to eliminate bacteria was determined by measuring the number of L. monocytogenes present in the spleen at the indicated time points. Mice were immunized with 500 (squares) or 106 (circles) actA-deficient L. monocytogenes organisms. Asterisks indicate naïve mice challenged with 2 × 10³ CFU of L. monocytogenes NPns. Time points shown are days 3, 5, and 7 after infection of naïve mice and after challenge of immune mice (in parentheses). Statistical analysis by Student’s t test indicates that P is <0.05 for all time points.

