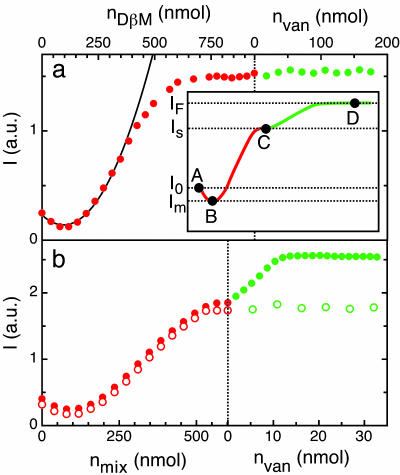
Fig. 3.
Light-scattering measurements of interaction between Van and functionalized PnP. Scattered light I of a PnP dispersion as a function of the added amount of surfactant, receptors, and ligands. nVan, nDβM, and nmix indicate the molar content of, respectively, Van, DβM, and two different 98.2/1.8 (mol ratio) mixtures of DβM with compound KdAdA or compound KlAlA. (a) Data obtained by adding increasing volumes of 10 mM solution of DβM (full red dots) and 5 mM Van solution (full green dots). Black line represents a parabolic fit to I at low coverage. (b) Data obtained by adding increasing volumes of 10 mM mixture of DβM and KdAdA-1 (full red dots) or 10 mM mixture of DβM and KlAlA (open red dots). The addition of Van to KdAdA ligand results in an increase of I up to a saturated value (full green dots), whereas KlAlA ligand prevents the Van recognition (open green dots). (Inset) Schematic representation of I as a function of the concentration of added surfactant (red line) and Van (green line); the positions A, B, C, and D, together with the corresponding I values (I0, Im, IS, and IF), match the sequence of pictures in Fig. 2.

