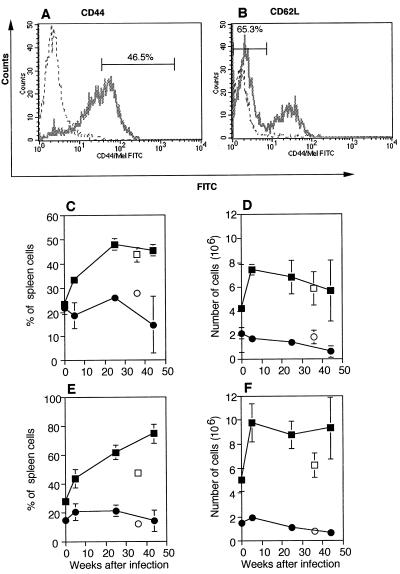
FIG. 2.
Changes in expression of activation markers after M. avium infection. (A and B) Representative staining of CD4+ T cells with CD44 (A) or CD62L (B) after 25 weeks of infection. The dotted lines show the results obtained for the negative controls. The bars show what was considered to be CD44bright or CD62L− and the percentage of CD4+ T cells that were CD44bright or CD62L− in each case. FITC, fluorescein isothiocyanate. (C to F) Percentages (C and E) and numbers (D and F) of CD4+ (▪) or CD8+ (•) cells that were CD44bright (C and D) or negative for CD62L (E and F). The number of cells was calculated by multiplying the percentage of activated T cells by the number of spleen cells recovered. All points represent means based on the data for three mice, and the error bars indicate standard deviations. Data for young normal control mice, age matched for 6 weeks after infection, are plotted at zero time. Data for the old normal control mice (CD4+ [□] and CD8+[○]) are plotted as if the mice were infected when they were 6 weeks old, the age when all mice were infected. The results of one representative experiment of three independent experiments are shown.

