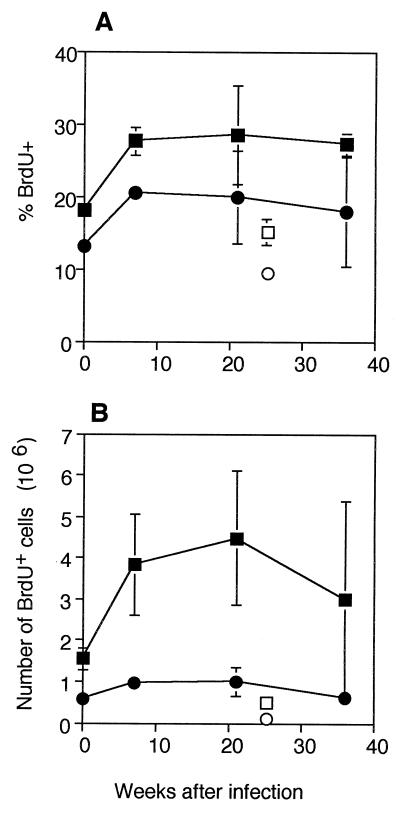
FIG. 3.
In vivo proliferation after infection: percentages (A) and numbers (B) of CD4+ or CD8+ BrdU+ T cells. Mice were fed BrdU in their drinking water for 7 days, and this was followed by staining of spleen cells for CD4 or CD8 and BrdU. The mice had been infected for different times, but their cells were assayed on the same day. The values are means based on the data obtained for three mice at different times after infection. The error bars indicate standard deviations. The results of one representative experiment of four similar experiments are shown. Symbols: ▪, CD4+, infected; □, CD4+, old uninfected; •, CD8+, infected; ○, CD8+, old uninfected.

