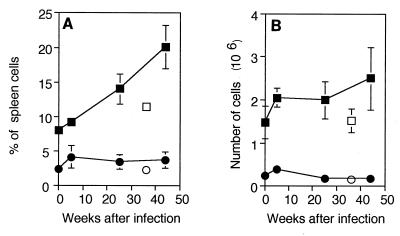
FIG. 6.
Changes in expression of CD25 after M. avium infection. Expression of CD25 was determined by flow cytometry. The mean percentages (A) and numbers (B) of CD4+ CD25+ (▪) and CD8+ CD25+ (bull;) T cells in three mice are shown. Data for young normal control mice, age matched for 6 weeks after infection, were plotted at zero time. Data for old normal control mice (CD4+[□] and CD8+[○]) were plotted as if the mice were infected when they were 6 weeks old, the age when all mice were infected. The results of one representative experiment of three similar experiments are shown.

