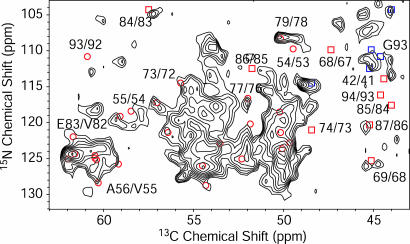
Fig. 4.
A 2D NHHC spectrum of AS fibrils (A form) grown from U-[13C,15N\K,V] AS diluted 1:2 with natural abundance AS. The spectrum was recorded at a static magnetic field of 18.8 T with a spinning speed of 11 kHz at a temperature of -13°C. The maximum t1 evolution time was 4 ms, and the total experiment time was 113 h. The spectrum was processed with exponential multiplication with a line-broadening factor of 50 Hz in both dimensions. Red circles represent Ni+1Cαi cross-correlations for amino acids involved in β-strands according to chemical-shift analysis, including also Ni+1Cα(V)i cross-peaks due to residual carbon labeling in V residues. Red squares represent Ni+1Cαi cross-correlations for amino acids not involved in β-strands according to their chemical shift. Blue squares represent intraresidue N-Cα correlation for Gly residues. For several correlations, sequential residue numbers are given.

