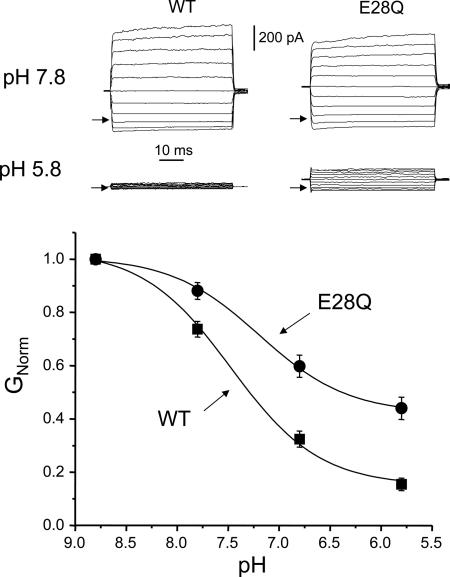
Fig. 2.
pH sensitivity of WT and mutant E28Q TASK2 channels. (Upper) Raw current–voltage (I–V) traces of WT and E28Q TASK2 at pH 7.8 and pH 5.8. Voltage was held at 0 mV, then clamped from -100 mV to +100 mV in 20-mV steps. Arrows indicate zero current level. (Lower) pH dose–response curves of WT (n = 14) and E28Q mutant. Solid curves are best fits to the Langmuir equation. GNorm = conductance normalized to that at pH 8.8.

