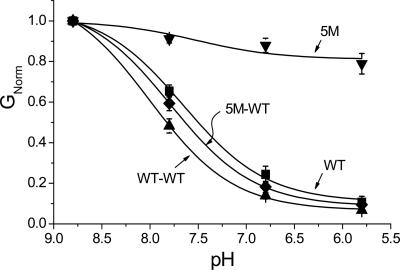
Fig. 5.
pH sensitivity of TASK2 concatemers. pH dose–response curves of the WT-WT concatemer (▴, n = 8) and 5M-WT concatemer (♦, n = 8). WT (▪, n = 14) and 5M (▾, n = 8) monomer results are shown for comparison. Solid curves are best fits to the Langmuir equation. GNorm = conductance normalized to that at pH 8.8.

