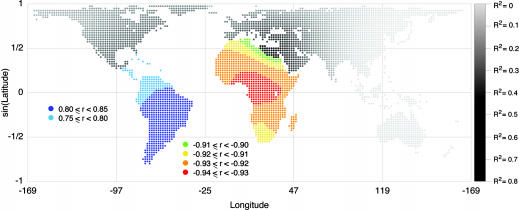
Fig. 5.
The origin of the human expansion. The color or shade of each of the 4,210 locations (shown as dots) indicates either a correlation coefficient r or an R2 value for the regression of expected heterozygosities in 53 HGDP-CEPH populations on geographic distance (corrected for large bodies of water) to the location displayed. Note that, for a simple linear regression, r2 = R2. Grayscale points indicate R2 values, as shown by the gradient on the right, and correlation coefficients r are displayed in Africa and South America to reflect the sign of the relationship between heterozygosity and geographic distance to locations in these continents. R2 values range from 0.757 to 0.870 in Africa and from 0.519 to 0.659 in South America. The maximum value of r (≈0.812) is observed when the origin is (30S, 50.2W); the minimum value of r (approximately -0.933) is observed when the origin is (4.3N, 12.8E).

