
Figure 3.
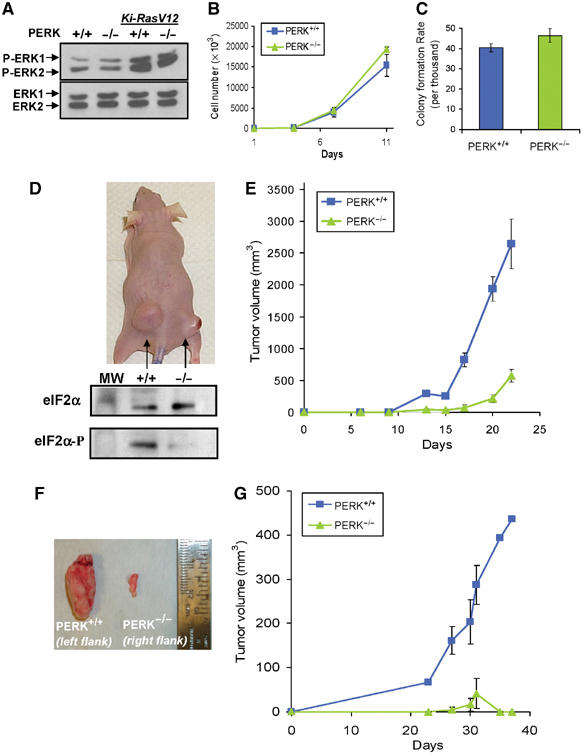
PERK affects the rate of tumor growth in vivo. (A) Immunoblot of untransformed PERK+/+ and PERK−/− MEFs, and MEFs stably transformed with Ki-RasV12, using a phospho-specific anti-ERK1/2 antibody (top), or an antibody against total ERK1 and ERK2 (bottom). (B) Growth rates of Ki-RasV12-transformed PERK+/+ and PERK−/− MEFs in vitro. (C) PERK+/+.Ki-RasV12 and PERK−/−.Ki-RasV12 MEFs form colonies in soft agar at similar rates. (D) Top, picture of a representative nude mouse injected with PERK+/+.Ki-RasV12 MEFs (left flank) and PERK−/−.Ki-RasV12 MEFs (right flank) with 3 × 10⁶ cells/site at 22 days following injection. The bottom panel shows eIF2α phosphorylation levels from the excised tumors shown in the top panel. Tumor sections were homogenized and immunoblotted for phospho-eIF2α and total-eIF2α. (E) PERK+/+ (blue line and squares) and PERK−/− (green line and triangles) tumor volumes from seven animals monitored over a period of 22 days following inoculation (mean±s.e.). (F) Tumors from a mouse injected with clone #2 PERK+/+.Ki-RasV12 MEFs (left) or clone #2 PERK−/−.Ki-RasV12 MEFs (right). (G) Growth of PERK+/+.Ki-RasV12#2 (blue line and rectangles) and PERK−/−.Ki-RasV12#2 (green line and triangles) tumors (N=4) monitored over a period of 37 days (mean±s.e.).