
Figure 4.
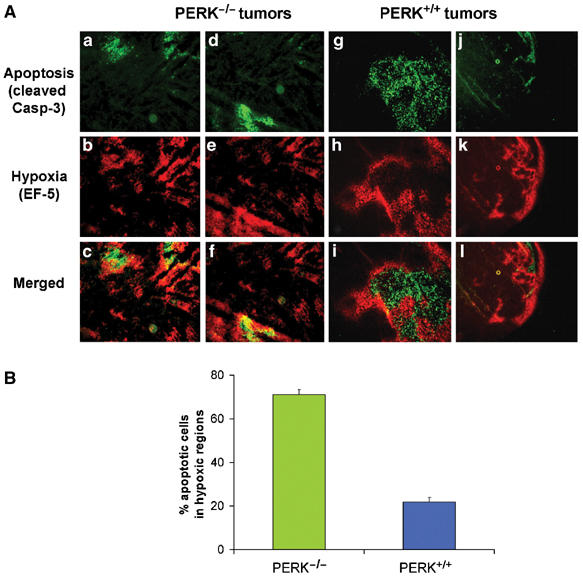
Hypoxic areas in PERK−/− but not in PERK+/+ tumors overlap with areas of apoptosis. (A) Sections of PERK−/− tumors (a−f) or PERK+/+ tumors (g−l) were incubated with a Cy3-conjugated antibody to EF-5 adducts (hypoxia, red) (b, e and h, k), followed by incubation with a FITC-conjugated anti-cleaved caspase-3 antibody (apoptosis, green) (a, d and g, j). Panels c, f and i, l are merged images showing both apoptotic and hypoxia areas. Two different PERK−/− (a−c and d−f) and PERK+/+ (g−i and j−l) tumor sections are shown. Bar=15 μm (a−i) and 60 μm (j−l). (B) Quantitation of four independent field images from PERK+/+ or PERK−/− tumors. The number of apoptotic cells in hypoxic (EF-5 positive) and normoxic (EF-5 negative) areas of each image were automatically counted and expressed as a percentage of the total number of apoptotic cells in the image. Error bars represent s.e. values.