
Figure 7.
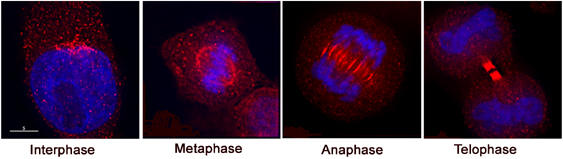
FIP4 exhibits a similar distribution to Arf6 during the cell cycle. Cells plated as outlined in Figure 5 were stained for FIP4 (red) or DNA (blue). The images shown are DeltaVision reconstructions and are typical of many images of this type. Scale bar 5 μm.