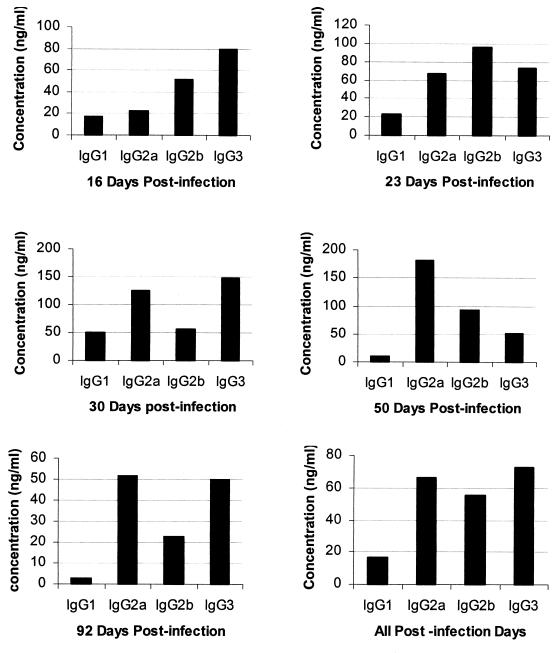
FIG. 5.
IgG subclass distribution in mice that had an IgG response to the E. chaffeensis infection. Plasma samples from all mice beginning 16 days to 92 days postinfection were analyzed by quantitative ELISA. The data for all mice are presented by days postinfection and the pooled data for mice from all postinfection dates from days 16 to 92 are also presented. Each bar represents a median IgG concentration determined from samples analyzed from eight mice.

