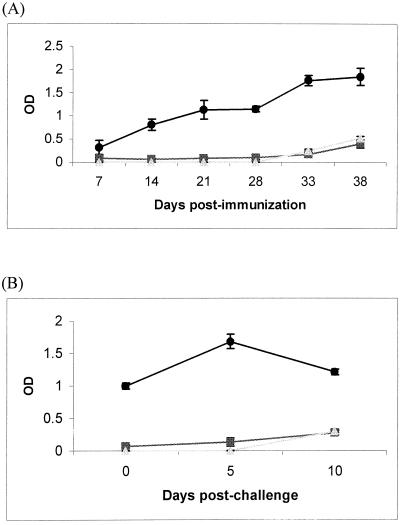
FIG. 4.
Serum IgG (A) and mucosal IgA (B) responses in C57BL/6 mice after intranasal inoculation with 50 CFU of virulent B. pseudomallei (•), 50,000 CFU of heat-killed B. pseudomallei (▪), or PBS (▴). Each symbol represents a 1:10 dilution of serum at the indicated days after the first inoculation at day 0, the second inoculation at day 14, and reinfection with 10,000 CFU of live bacteria at day 28 (A), or represents undiluted nasal wash at the indicated days after reinfection with 10,000 CFU live bacteria at day 28 (B), from three mice pooled together. Results represent means ± standard deviations of triplicates. OD, optical density.

