
Figure 5.
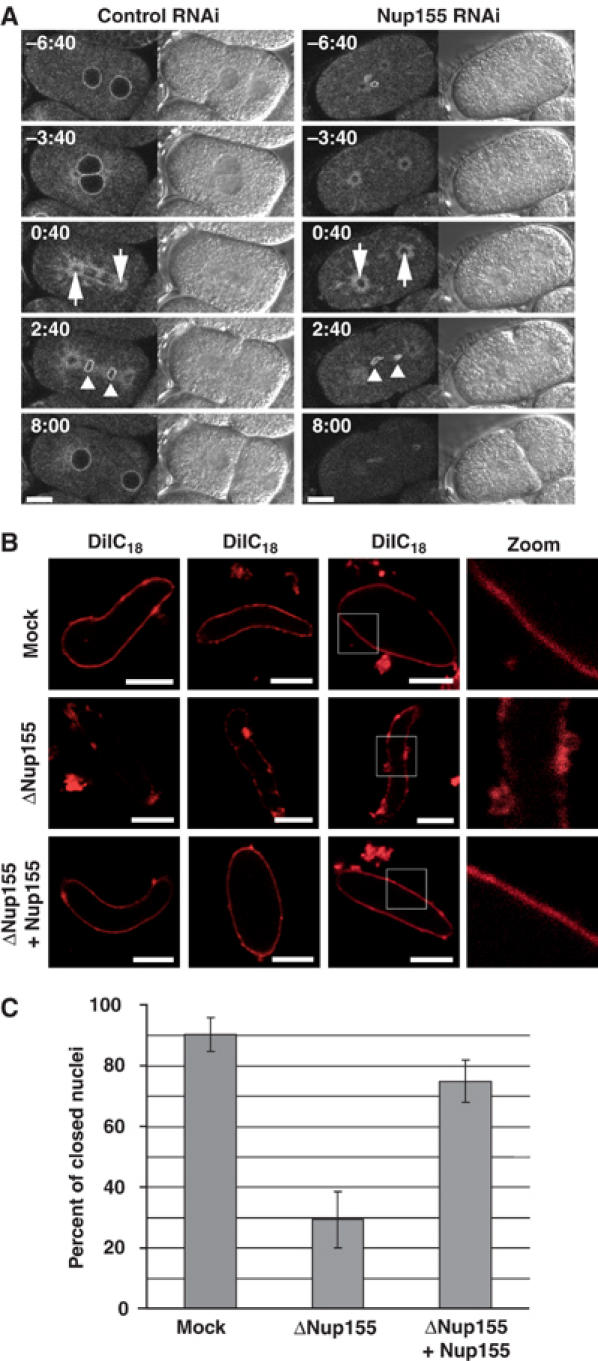
Membrane defects upon Nup155 depletion. (A) Control (left panels) or Nup155-depleted (right panels) embryos expressing GFP-MAN1 were observed by time-lapse microscopy. Centrosomes are indicated with arrows at anaphase (0:40) while triangles point to GFP-MAN1 association with chromatin during telophase (2:40). See Supplementary video 7. Scale bars, 10 μm. (B) Nuclei assembled in vitro in mock- or Nup155-depleted extracts, or in depleted extracts after addition of recombinant Nup155, were labelled with the membrane dye DiIC18 before fixation in 2% paraformaldehyde and 0.5% glutaraldehyde and analysed by confocal microscopy. Left and right image sets were derived from independent experiments. The two left panels are individually adjusted in signal intensity to illustrate the nature of the membranes best possible. Equal exposure times were chosen for right images. (C) Quantitation of closed NEs from panel B. In three independent experiments, 100 nuclei from each reaction were examined. The average of the three independent experiments is shown; error bars represent the total variation over the experiments.