
Figure 6.
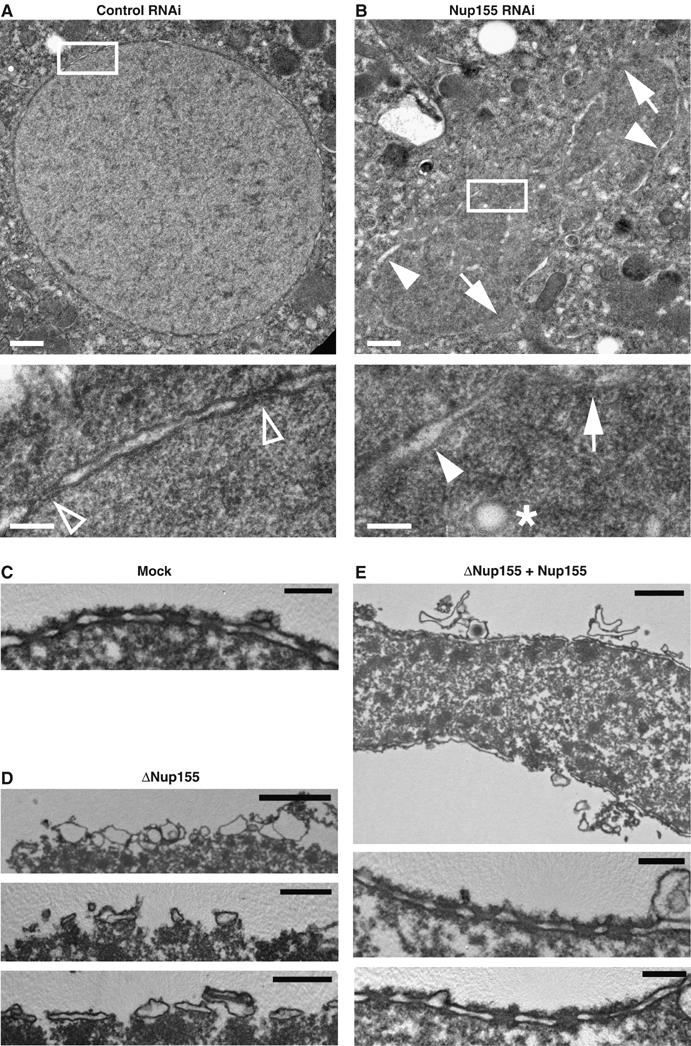
TEM analysis of NE defects in vivo and in vitro. (A, B) Control (A) or Nup155-depleted (B) C. elegans embryos were fixed by high-pressure freezing and processed for TEM. White boxes in upper images indicate the area shown at higher magnification below. In the higher magnifications, chromatin is localized to the lower right half of the micrographs. In panel A, empty triangles point to NPCs, which were not visible in Nup155 RNAi samples. In panel B, arrows point to areas where the chromatin surface is not covered by membranes while filled triangles indicate chromatin surface that is covered by membranes without NPCs. An asterisk indicates a membrane vesicle or tubule present inside the chromatin space. Scale bars, 0.5 μm (upper images) and 0.1 μm (lower images). (C–E) In vitro-assembled nuclei as in Figure 4A were processed for TEM. (C) Mock depleted. Scale bar, 0.2 μm. (D) Nup155 depleted. Scale bars, 2 μm (upper image) and 0.5 μm (middle and lower images). (E) Nup155 depleted followed by addition of recombinant Nup155. Scale bars, 1 μm (upper image) and 0.2 μm (middle and lower images).