
Figure 3.
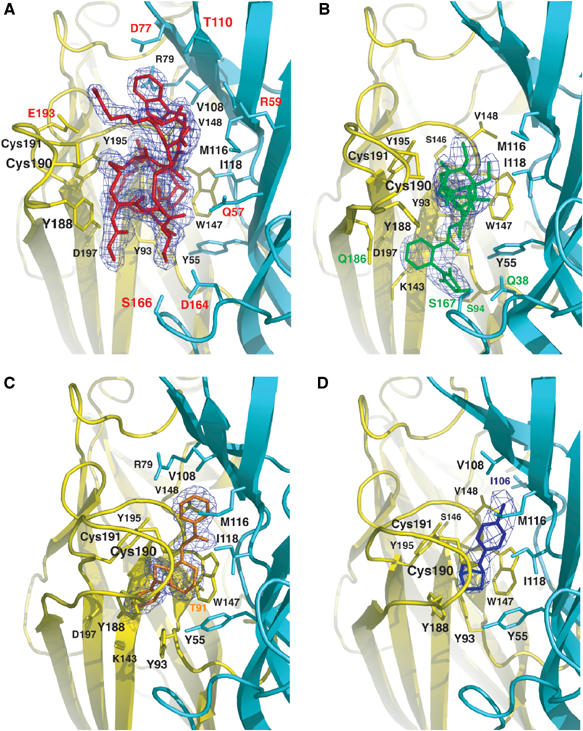
The A-AChBP subunit interface in the antagonist and agonist complexes. Side views of the bound antagonists (A) ImI, buried under loop C, and (B) MLA (same orientation), and of the bound agonists (C) LOB and (D) EPI in similar orientations. The 2.0–3.4 Å resolution omits 2FO–Fc electron density maps contoured at 1.4σ are shown in blue. The main and side chains from the (+) and (−) faces of the subunit interface are in yellow and cyan, respectively. Those side chains that interact specifically with ImI, MLA, LOB, and EPI are labeled red, green, orange, and blue, respectively.