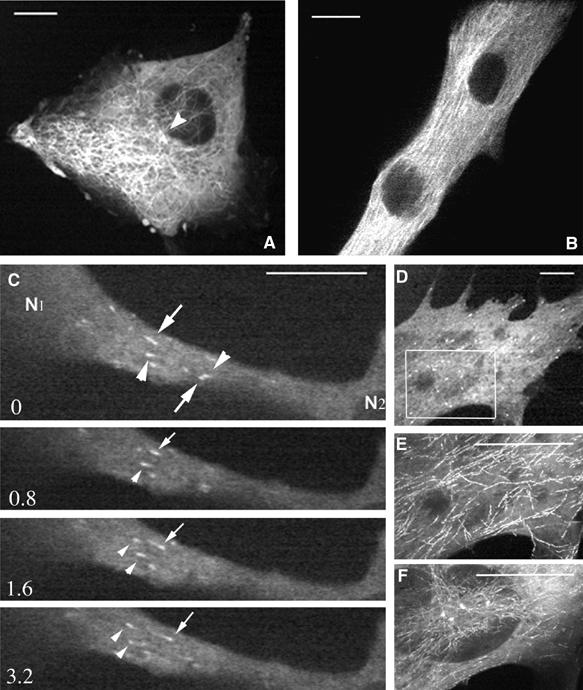
Figure 2.

MT network organization during myogenic differentiation. Myogenic cells expressing GFP-tubulin (A, B) or GFP-EB1(C–F) were imaged every second during 12 (A) or 10 min (B); every 0.4 s for 4 min (C) and every 0.6 s for 3 min (D–F). Images A and B, selected from movies, show that MTs emanate from the MTOC in myoblasts (A, arrowhead) and display longitudinal organization in myotubes (B). (C) shows time-lapse sequence of GFP-EB1 movements (movie 2). In a myotube region located between two successive nuclei (N1, N2), we observed that some GFP-EB1 comets moved from nucleus N1 to N2 (arrows) and others in the opposite direction (arrowheads). EB1 comets were followed at two depths (E, F) of the same cell area (D, rectangle). Long linear tracks (E) and dots alignments (F) of EB1 movements were observed by projection analysis generated by merging the images of movies 5S5 and 5S6, respectively. Time is in seconds, bar=10 μm.
