Figure 4.

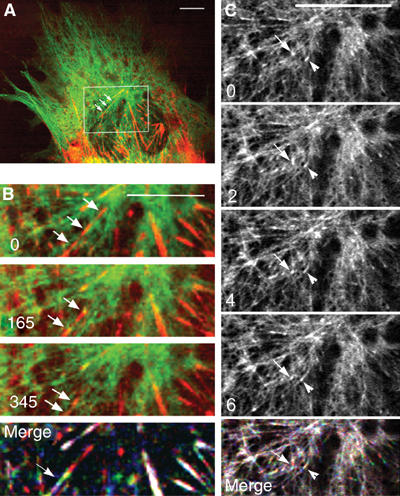
Myosin intermediates tracks MT plus end at the beginning of differentiation. A live myotube (24 h of differentiation) expressing GFP-EB1 (green) and Dsred-myosin (red) was analyzed by confocal microscopy. This figure contains images from movie 4_1. The rectangle in (A) represents the area magnified in (B, C) (movies 4_2 and 4_3, respectively). In (B), images of EB1 and myosin recording show that myosin structures (arrows) displayed red and yellow labeling during their excursion. Life history of myosin displacement (merge) was visualized by merging myosin images, from movie 4_2, captured at time 0 (red), 165 (green) and 345 s (blue). (C) shows successive images of the EB1 recording. Two distinct EB1 comets (arrow, arrowhead) move in the same direction as myosin rods. In (B, C), time 0 indicates the initial location of selected fluorescent myosin or EB1 that was followed. Life history of EB1 displacement (merge in C) was obtained by merging images, from movie 4_3, at time 2 (red), 4 (green) and 6 s (blue). Bar=10 μm.
