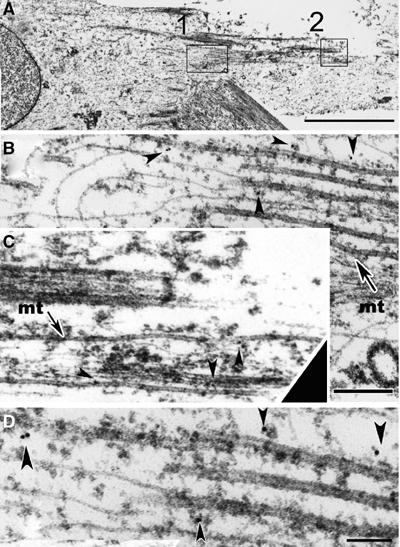
Figure 6.

Electron micrographs of immunogold labeling of myosin in a myotube. Two regions of a myotube differentiated for 24 h are marked (A, rectangles 1 and 2). Two magnifications of region 1 are reported (B, D), while an enlarged view of region 2 is shown in (C) (same scale as B). Myosin labeled with 10 nm gold particles (arrowheads) is in close association with MTs (B and C, mt). Adjacent filaments are devoid of immunogold particles. Bar=3 μm (A). Bar=200 nm (B). Bar=100 nm (D).
