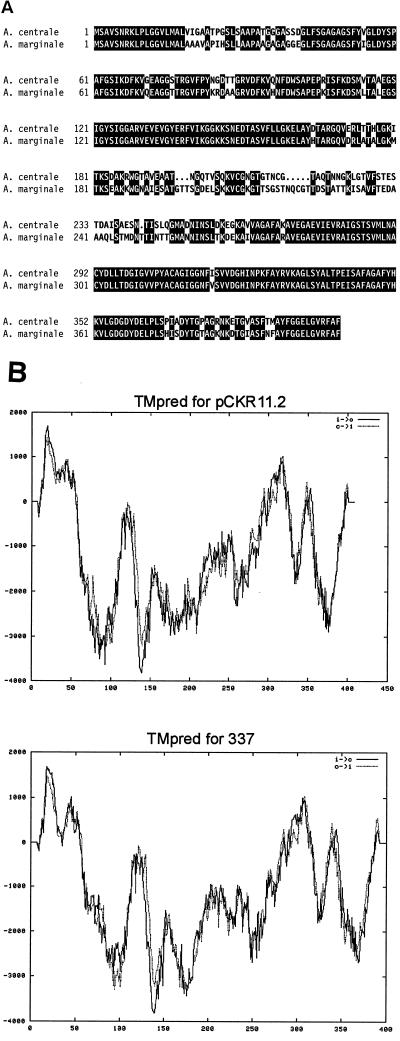
FIG. 1.
Comparison of the full-length A. marginale 11.2 MSP-2 (21) with A. centrale MSP-2 obtained postimmunization from vaccinate 337. (A) Amino acid sequence alignment. Areas of amino acid substitutions, insertions, and deletions are indicated by a white background, and areas of amino acid identity have a black background. (B) Secondary structure prediction. The predicted membrane orientation calculated by using TMPred (http://www.ch.embnet.org/software/TMPRED_form.html) is plotted on the y axis versus the amino acid position on the x axis for A. marginale 11.2 MSP-2 (upper panel) and A. centrale vaccinate 337 MSP-2 (lower panel). The solid line (i > 0) is the calculation performed from the N to the C terminus; the dashed line (0 > i) is the calculation performed from the C to the N terminus.

