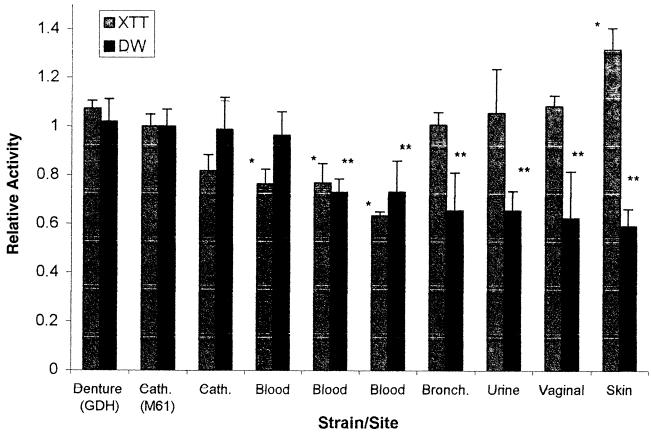
FIG. 2.
Comparison of biofilms formed by different C. albicans isolates. The graph shows XTT and DW values for isolates of C. albicans obtained from different clinical sites. Cath., catheter; Bronch., bronchial site. Results were normalized to those for C. albicans strain M61. Assays were performed in quadruplicate. Each result is representative of at least two experiments. All values are means and standard deviations. Comparisons are significant for P values of <0.0011. A single asterisk indicates a P value of <0.001 for an XTT value of an isolate compared to M61; a double asterisk indicates a P value of <0.001 for a DW value of an isolate compared to M61.

