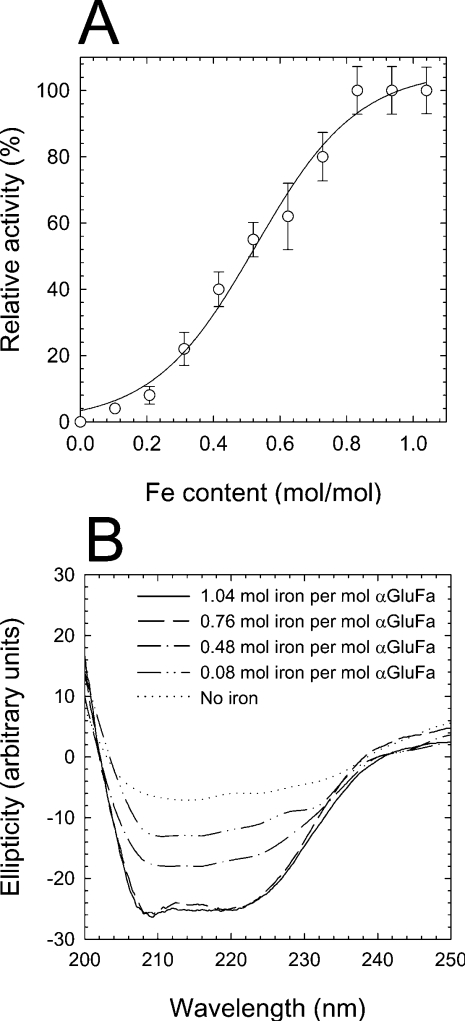
Figure 1. Dependence of αGluFa activity on iron content.
(A) Influence of iron removal on αGluFa activity. Purified enzyme (50 μM in 100 mM citrate buffer, pH 3.0) was incubated with 1 mM EDTA. At different time intervals, two aliquots from the mixture were taken. One of these was used to determine the ability to hydrolyse sucrose using the standard methods, and the second one was used to determine the content of iron by ICP-MS. Hydrolytic activity was measured in 100 mM sodium citrate buffer (pH 3.0) using sucrose as substrate at 50 °C, and is expressed as a percentage of that found in the absence of EDTA. (B) CD of αGluFa. The secondary-structure CD was measured at wavelengths between 200 and 250 nm. The CD spectra were measured for recombinant (------) and EDTA-dialysed αGluFa (50 μM) in 100 mM sodium citrate buffer (pH 3.0) for 6, 11 and 24 h (corresponding to 0.76, 0.48 and 0.08 mol of iron/mol of αGluFa respectively). The metal ion content of αGluFa was determined using a PerkinElmer Life Sciences ICP-MS before CD was recorded.

