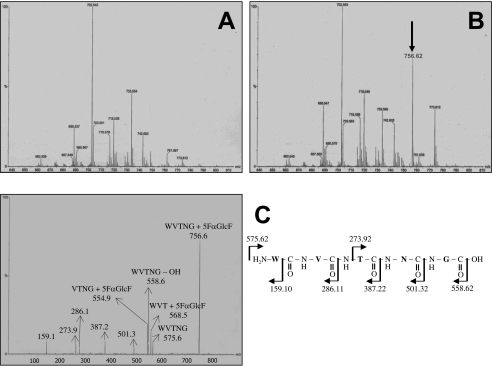
Figure 5. Identification of catalytic residues by labelling with 5FαGlcF and MS/MS analysis.
Comparative mass spectra of (A) unlabelled and (B) labelled F. acidiphilum α-glucosidase. The arrow indicates the peptide unique to the peptic digest of labelled enzyme. Only the fragments of m/z ranging from 640 to 810 are shown. No differences were observed above m/z 810 and below m/z 640. (C) MS/MS spectrum of the 5FαGlcF labelled peptide (m/z 755.620) and an interpretation of the spectrum.

