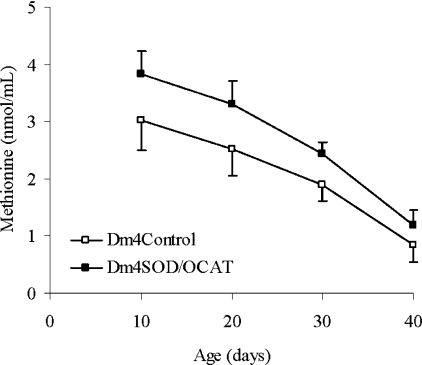
Figure 5. Methionine content.
Results are presented as means±S.D. of the data for three Dm4Control (C1–C3; □) and three Dm4SOD/OCAT combinations (E1–E3, ■) and are expressed as nmol/ml of initial preparation [5% (w/v) homogenates in 5% (w/v) metaphosphoric acid]. Results for each combination, at each age, were obtained from four independent preparations of 50 flies each. The methionine content was significantly higher in Dm4SOD/OCAT flies than in Dm4Control flies (P<0.0005) and decreased as a function of age (P<0.0005).

