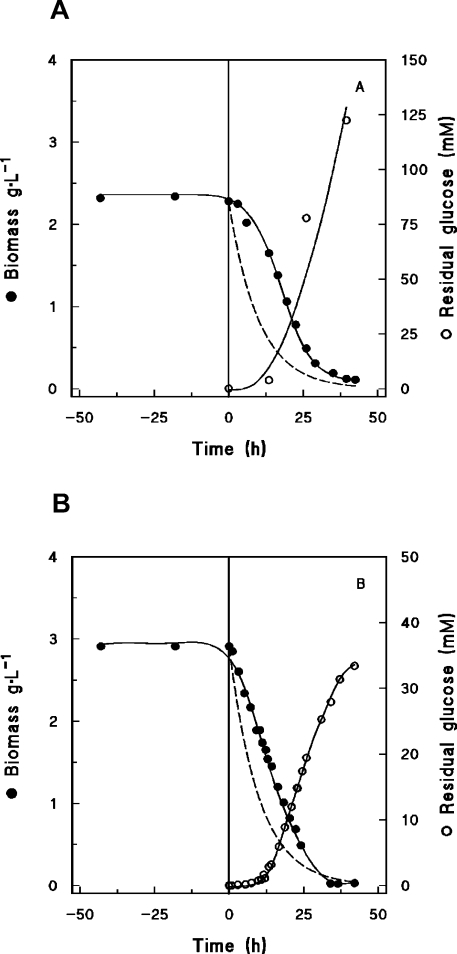
Figure 1. Anaerobic (100% CO2) (A) and aerobic (79% CO2/21% O2 mixture) (B) chemostat cultivations of S. cerevisiae nce103Δ null mutant.
At zero time (vertical line), the gas supply was switched to 100% N2 (A) or air (B). ●, biomass (dry weight); ○, residual glucose concentration; -----, theoretical wash-out curve. Independent replicate experiments gave identical results.

