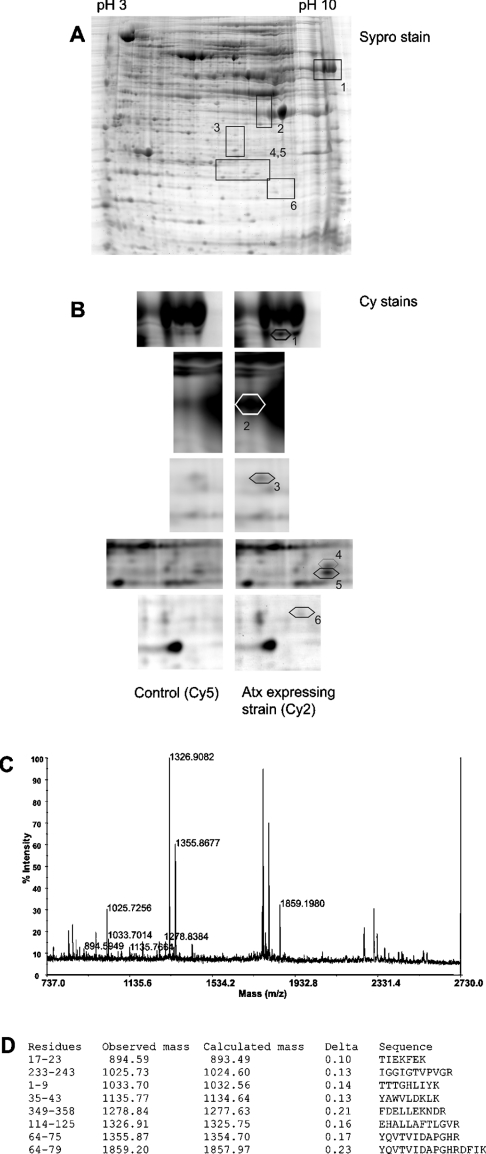
Figure 3. Two-dimensional image of yeast proteins from Atx-expressing and control yUP10 strains and protein identification by MS.
(A) A representative Sypro-stained gel with boxed segments that are shown enlarged in (B) and the corresponding spot numbers. (B) Enlarged views after fluorescence scanning to identify the differentially expressed proteins from the two strains: proteins from the Atx-expressing strain were stained with Cy2 and those from the control strain were stained with Cy5. The differentially expressed proteins are marked spots 1–6 (see Table 1 for details). (C) MALDI–TOF-MS spectrum obtained from tryptic digest of spot 1. (D) Masses of ionized peaks were matched with those calculated for tryptic peptides of translation elongation factor Tef1/2p. Peptide sequences matching the peaks in the spectrum are shown.

