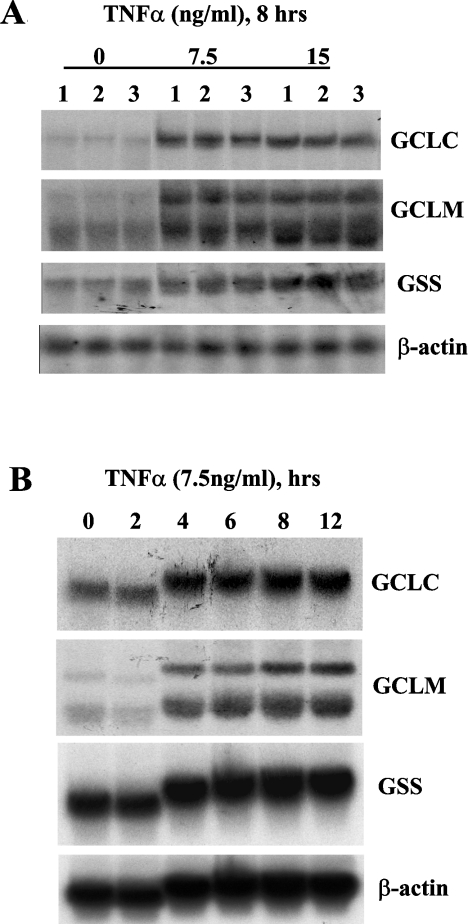
Figure 4. Effect of TNFα on expression of GCLC, GCLM and GSS in H4IIE cells.
(A) H4IIE cells were treated with varying concentrations (0–15 ng/ml) of TNFα for 8 h. Total RNA (20 μg/lane) was subjected to Northern-blot analysis using cDNA probe for GCLC as described in the Materials and methods section. The same membrane was sequentially rehybridized with cDNA probes for GCLM, GSS and β-actin to ensure equal loading. (B) H4IIE cells were treated with TNFα (7.5 ng/ml) for varying duration (0–12 h) and processed for Northern-blot analysis as described above.

