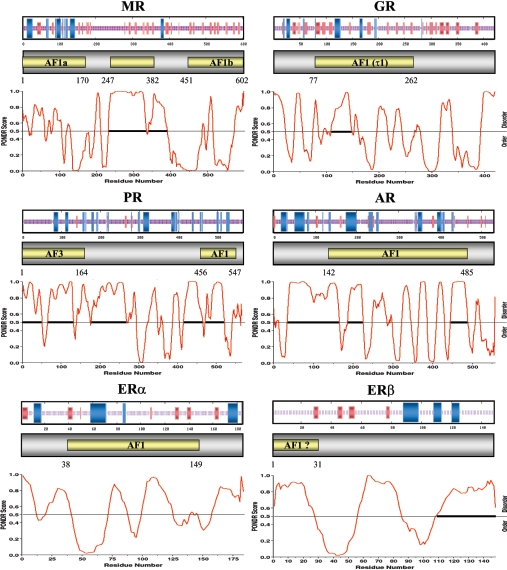
Figure 2. Secondary and natural disordered structure predictions.
At the top of the panel representing each SHR-NTD is a consensus secondary structure prediction. The blue and red lines/bars represent α-helix and β-strand respectively [157]. Below is shown the PONDR® (www.pondr.com) plots indicating likely regions of natural disordered structure (scores above the 0.5 threshold); the longer the region the more accurate the prediction. The solid horizontal lines represent regions of highest probability, with 40 or more consecutive residues predicted to be disordered.

