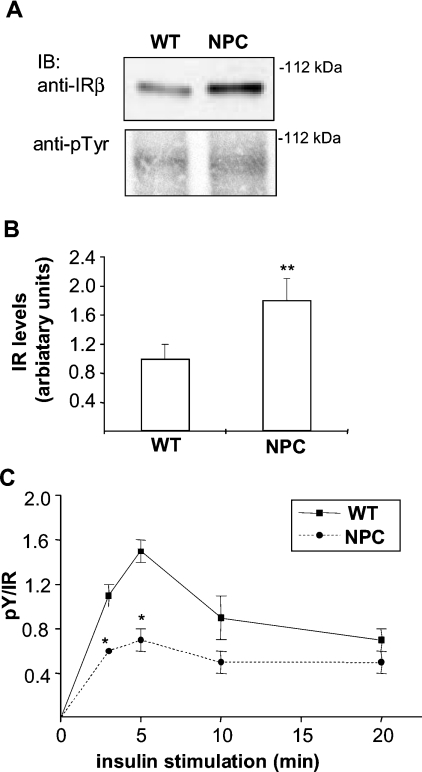
Figure 2. IR levels and activation in WT and NPC hepatocytes.
(A) WT and NPC hepatocytes were stimulated with insulin for 0–20 min and cell lysates were analysed by Western blotting for IR levels (with anti-IRβ antibody) and phosphorylation (with anti-pTyr antibody). Representative immunoblots (IB) after 5 min of insulin stimulation are shown. (B) Quantification of IR levels and (C) IR activation as a function of time. Values are means±S.E.M., n=44 in (B) and n=4–6 in (C). *P<0.05, **P<0.001, P values from a two-tailed Student's t test in all experiments.

