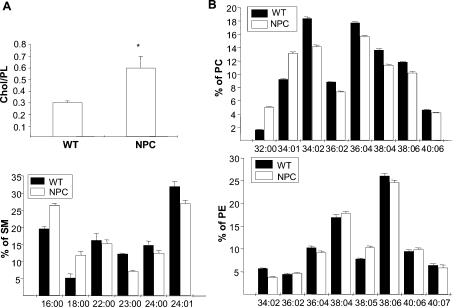
Figure 5. MS analysis of WT and NPC plasma-membrane lipid composition.
(A) Cholesterol/PL ratio. Values are means±S.D. for two independent determinations performed in triplicate. *P<0.05. The total amount of PLs was not significantly different between NPC and WT samples. (B) Acyl chain lengths and saturation of major PL classes. Species constituting a minimum of 5% of total in each PL class are included. Values are means±S.D. for a representative experiment performed in triplicate. PE, phosphatidyl ethanolamine.

