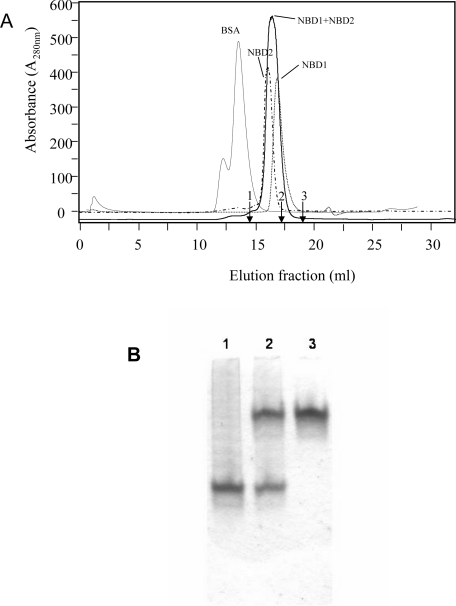
Figure 3. Gel-filtration chromatography and native PAGE of NBD1+NBD2 mixture.
(A) Chromatographic profiles of Superdex 200 column fractions showing the elution of NBD1, 27 kDa; NBD2, 30 kDa; an NBD1+NBD2 mixture; and BSA, 67 kDa. The Superdex 200 column was calibrated with other proteins (indicated by arrows): 1, 43 kDa ovalbumin; 2, 25 kDa chymotrypsinogen A; 3, 13.7 kDa RNase A. Protein elution was recorded at A280. (B) Native PAGE was loaded with NBD2 (3 μg, lane 1), a mixture of NBD1 and NBD2 (3 μg for each NBD, lane 2) and NBD1 (3 μg, lane 3).

