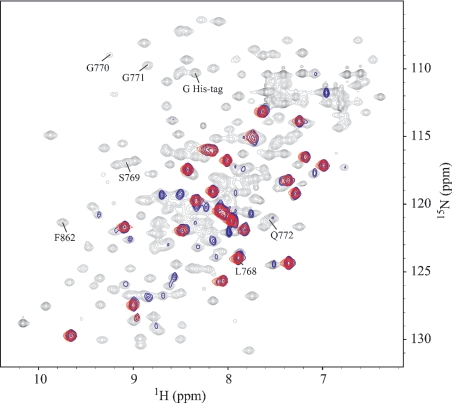
Figure 5. 1H-15N HSQC spectra of NBD1 with different 15N-labelling methods.
Overlaid contour plots of the HSQC spectra at 298 K of NBD1 obtained with uniform labelling in E. coli (black, 220 μM), in vivo selective labelling with 15N-Leu in E. coli (blue, 220 μM) and in vitro selective labelling with 15N-Leu by cell-free expression (red, 80 μM). The last HSQC spectrum shows the 23 Leu signals from NBD1 and that of the His tag.

