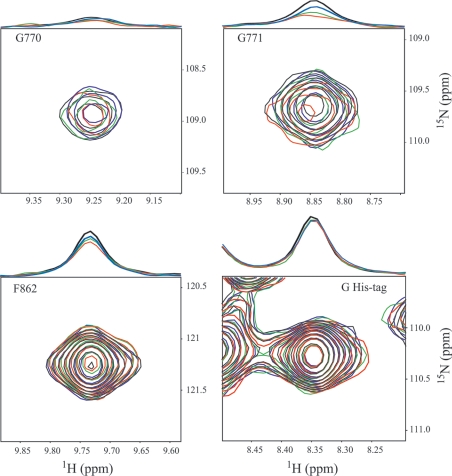
Figure 6. NMR titration experiments of NBD1 by NBD2.
The HSQC spectra of NBD1 (220 μM) were titrated in the presence of 1 mM Mg-ATP by addition of 0:1 (black), 0.35:1 (blue), 1:1 (green) and 1.6:1 (red) molar equivalents of NBD2. The selected regions are centred on the backbone correlations of Gly770, Gly771, Phe862 and one Gly of His tag. On the top of each two-dimensional spectrum, the extracted 1H spectrum at the 15N chemical shift of these residues is drawn, which has been normalized relative to the Gly His-tag signal.

