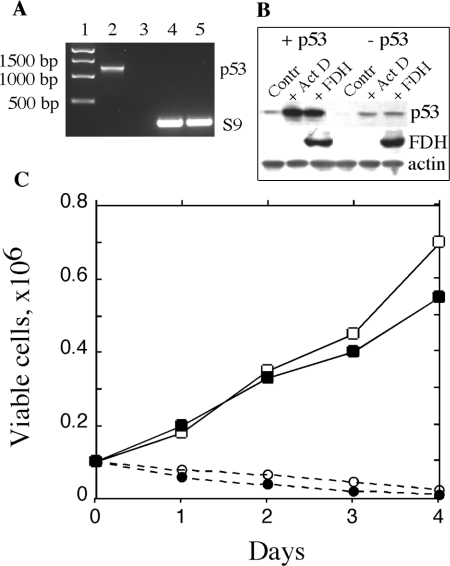
Figure 2. Effect of p53 knockdown on proliferation of A549 cells expressing FDH.
(A) Levels of p53 mRNA in Tet-On A549/FDH cells before (lane 2) and after (lane 3) p53 knockdown evaluated by reverse transcriptase-PCR. Samples were normalized by levels of ribosomal protein S9 mRNA (lanes 4 and 5, respectively). Lane 1, standards. (B) Levels of p53 and FDH in Tet-On A549/FDH cells, before (+p53) and after (−p53) p53 knockdown, assessed by immunoblot techniques. Contr, control (untreated cells); +Act D, 48 h after beginning of treatment with 50 nM Act D (treatment was carried out for 24 h); +FDH, after induction of FDH for 48 h. Samples were normalized by levels of actin. (C) Proliferation of p53-proficient Tet-On A549/FDH cells after induction of FDH (○) or treatment with 50 nM Act D (●), and of p53-deficient (knocked down p53) Tet-On A549/FDH cells after induction of FDH (□) or Act D treatment (■). Viable cells were assessed by Trypan Blue exclusion.

