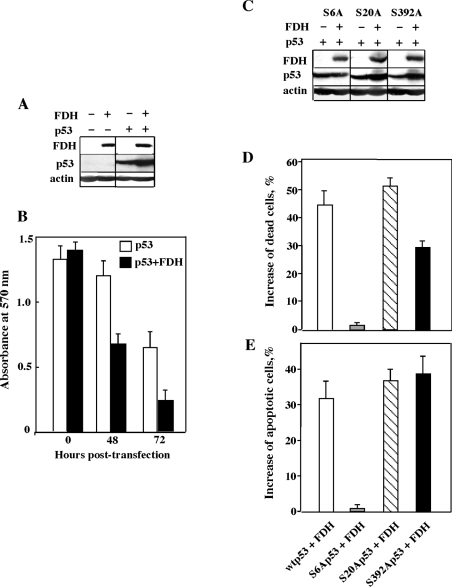
Figure 8. Effects of transient FDH expression on H1299 cells expressing wild-type and mutant p53.
(A) Levels of FDH and wild-type p53 in H1299 cells after transient transfection. (B) MTT assay of cells transfected with p53 alone (open bars) or in combination with FDH (solid bars). (C) Levels of mutant p53 in H1299 cells in the presence and in the absence of FDH. (D) Changes in number of dead cells (assessed by MTT assays) after co-expression of wild-type (wt) or mutant p53 with FDH (shown as percentages of dead cells observed after expression of p53 alone). (E) Changes in number of apoptotic cells (assessed by caspase-9/6 assays) after co-expression of wild-type or mutant p53 with FDH (shown as percentages of apoptotic cells observed after expression of p53 alone). Each bar represents the mean±S.E.M. for four independent experiments performed in quadruplicate.

