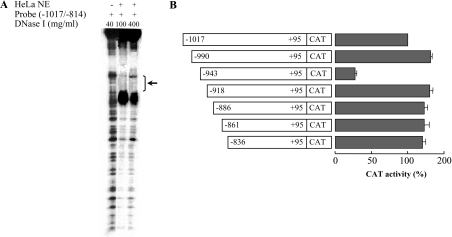
Figure 4. DNase footprinting analysis and deletion analysis of the PiC gene promoter inhibitory domain.
(A) The labelled DNA probe, corresponding to −1017/−814 nt of the PiC gene promoter, was partially digested by 100 or 400 μg/ml DNase I in the presence of 30 μg of HeLa cell nuclear extracts (NE). In the left-hand lane, the DNA probe was digested by 40 μg/ml DNase I in the absence of nuclear extracts. The protected region is indicated by a bracket and an arrow; it extends between −943 and −919 nt. (B) The indicated deletion mutants of the region from −1017 to −837 nt of the PiC gene promoter were cloned into the pEMBL8-CAT plasmid and tested for CAT expression activity in transfected HeLa cells. Numbering indicates the extent of fragments, whereas dark bars indicate CAT activity. The values were set relative to the construct −1017/+95. Means±S.D. for four duplicate independent experiments are shown.

