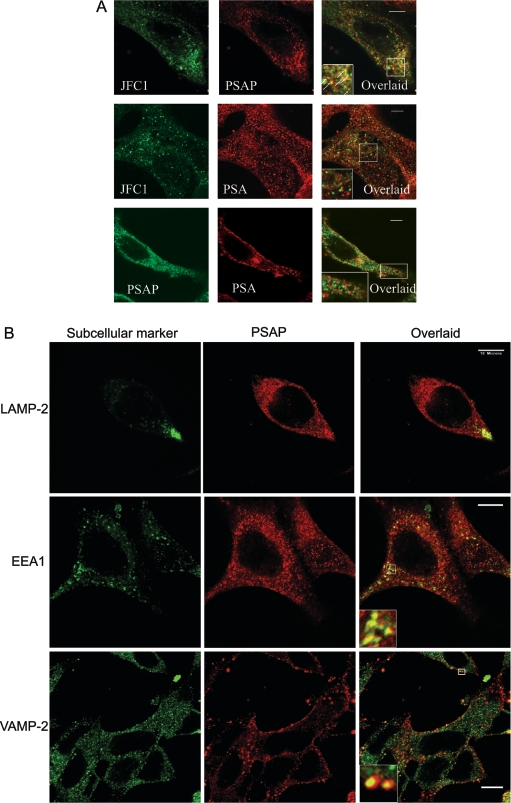
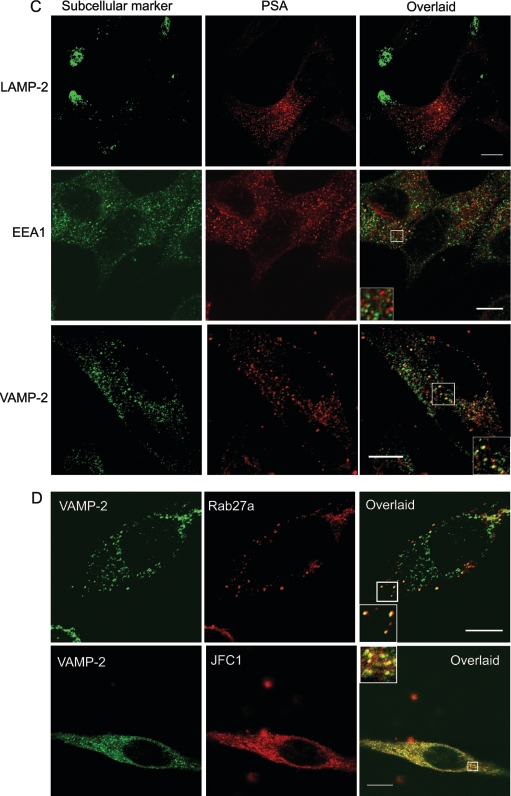
Figure 4. Subcellular localization of JFC1 in association with PSAP and PSA in LNCaP cells.
Immunofluorescence analysis was performed as described for Figure 1 and in the Experimental section. (A) Upper panels: subcellular localization of JFC1 and PSAP was analysed using the anti-JFC1 antibody described in Figure 1 and a mouse monoclonal antibody raised against PSAP (NeoMarkers). The inset shows the magnified image of the area selected in the overlaid panel. The arrows indicate co-localization of JFC1 and PSAP on punctate structures. Middle panels: the experiments were performed as described above, except that an anti-PSA antibody was used in the place of the anti-PSAP antibody. The inset shows a magnified image of representative punctate structures that were positive for PSA staining, but negative for JFC1 and vice versa. Bottom panels: immunofluorescence analysis of the distribution of PSA and PSAP in LNCaP cells is shown. Experiments were performed as described above. The magnified image shows an area of the cells where co-localization is undetectable. Co-localization between PSA and PSAP was only detectable in the perinuclear area. Scale bar, 5 μm. (B, C and D) Subcellular distribution of PSAP, PSA, JFC1 and Rab27a in relation to distinct subcellular organelle markers was evaluated by immunofluorescence. LAMP-2, lysosome-associated membrane protein-2. Insets show magnified images of the indicated areas. Scale bar, 10 μm.


