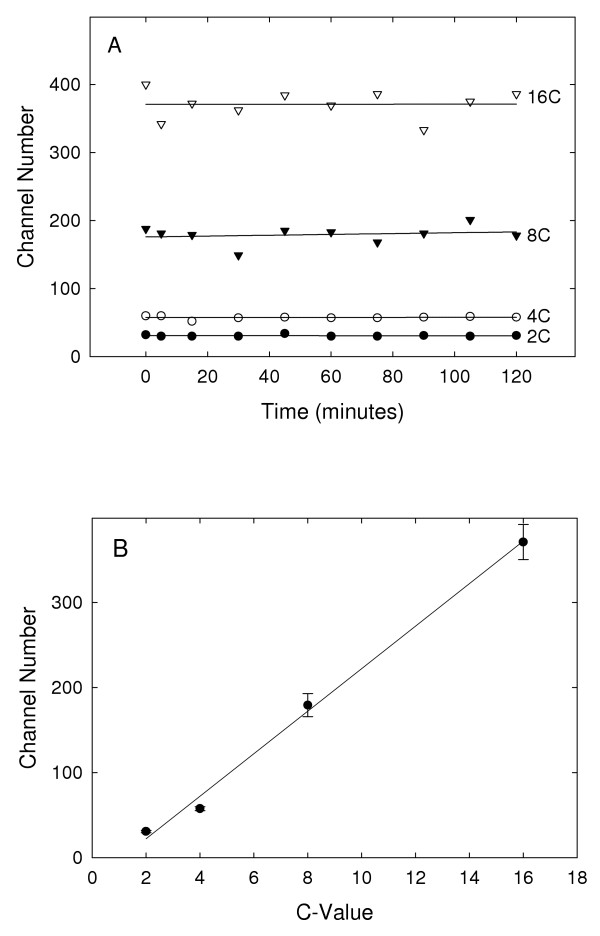
Figure 5.
Analysis of the stability and amounts of targeted GFP fluorescence within nuclei following homogenization. Biparametric flow cytometric analyses were done of transgenic plants constitutively expressing nuclear GFP at various times following homogenization. A. The modes of the GFP fluorescence distributions for the four classes of nuclei (2C, 4C, 8C, 16C) are plotted as a function of time after homogenization. B. The modes obtained from the GFP fluorescence distributions were averaged across the time course for the different nuclear classes, and these mean values are plotted against C-value. Error bars indicate standard deviations.

