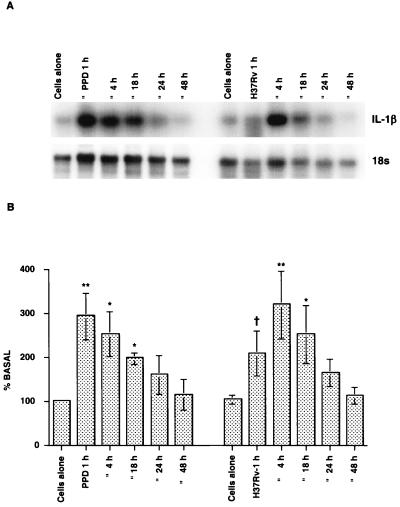
FIG. 5.
Kinetics of IL-1β mRNA expression in splenocytes after PPD or M. tuberculosis H37Rv stimulation. Whole spleen cells from BCG-vaccinated guinea pigs were stimulated with either PPD (15 μg/ml) or M. tuberculosis H37Rv (MOI, 1:30) for specific periods of time. At the end of each incubation period, cells were harvested and used for RNA analysis, and the levels of expression were analyzed as described in the text. (A) Representative RNA blot; (B) densitometric analysis of the means and standard errors from three experiments. A dagger indicates that the P value was <0.01 in comparison with the data obtained for the unstimulated cultures, as determined by Student's t test; one asterisk indicates that the P value was <0.001 to 0.009 in comparison with the data obtained for the unstimulated cultures, as determined by Student's t test; and two asterisks indicate that the P value was <0.0005 in comparison with the data obtained for the unstimulated cultures, as determined by Student's t test.

